Factoring Statistics
The international factoring industry phenomenal growth during 2021 and 2022. International factoring volumes reached record levels of US$ 740 billion during 2022.
Exhibit 1: International Factoring Volumes (US$ Billion)
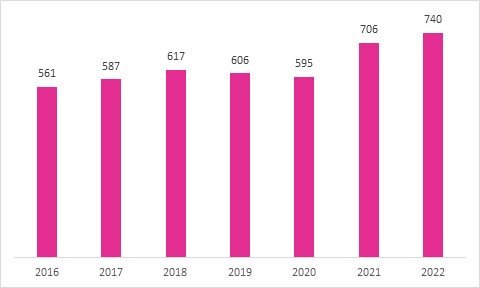
Source: FCI Annual Review 2023
Europe accounted for nearly two-third of the international factoring volumes during 2022, followed by Asia-pacific accounting for 32.5% of the volumes (Exhibit 2). Some of the top FCI member countries by international factoring volumes in 2022 included Spain, Taiwan, China, Italy and Germany (Exhibit 3). International factoring volumes in India was US$ 1 billion in 2022, as compared to US$ 109.7 billion for China during the year.
Exhibit 2: Top Regions by International Factoring Volumes in 2022
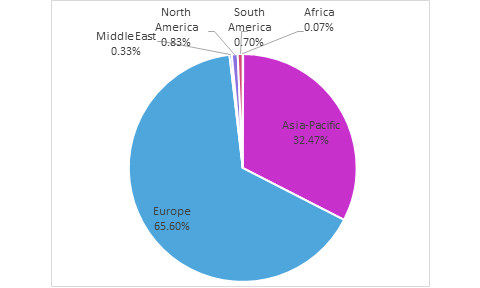
Source: FCI
Exhibit 3: Top 10 FCI Member Countries by International Factoring Volumes in 2022
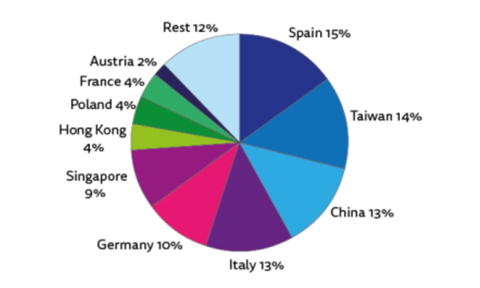
Source: FCI
Table 1: World Factoring Turnover (in million euros)
| Region | 2016 | 2017 | 2018 | 2019 | 2020 | 2021 | 2022 |
| Middle East | 7583 | 8019 | 8840 | 9937 | 9516 | 9176 | 9376 |
| Africa | 20393 | 21761 | 22174 | 24562 | 25242 | 32345 | 41822 |
| North America | 95072 | 92392 | 90101 | 86742 | 66598 | 97000 | 103900 |
| South America | 104396 | 117088 | 121248 | 132031 | 83559 | 86048 | 124097 |
| Asia Pacific | 555536 | 657189 | 695562 | 687594 | 697093 | 751096 | 881312 |
| Europe | 1592988 | 1701939 | 1829143 | 1976239 | 1844721 | 2118041 | 2498697 |
| Total | 2375968 | 2598388 | 2767068 | 2917105 | 2726729 | 3093706 | 3659204 |
Table 2: World Factoring Turnover for the year 2022 (in million euros)
| Region | Domestic Factoring | International Factoring | Total Factoring | No. of Factors | International Trade | Intl Ftg as % of Intl Trade |
| Middle East | 7036.0 | 2340.0 | 9376.0 | 18.0 | 2591445.7 | 0.09% |
| Africa | 41355.1 | 466.6 | 41821.7 | 184.0 | 1295440.1 | 0.04% |
| North America | 98050.0 | 5850.0 | 103900.0 | 255.0 | 6309275.4 | 0.09% |
| South America | 119197.0 | 4900.0 | 124097.0 | 843.0 | 2493350.7 | 0.20% |
| Asia Pacific | 653171.3 | 228140.7 | 881312.0 | 2199.0 | 16558888.0 | 1.38% |
| Europe | 2037832.2 | 460864.9 | 2498697.1 | 700.0 | 17016117.4 | 2.71% |
| Total | 2956641.6 | 702562.3 | 3659203.8 | 4199.0 | 46264517.3 | 1.52% |
Table 3: Asia-Pacific Factoring Turnover for the year 2022 (in million euros)
| Country | Domestic | International | Total | Companies |
| New Zealand | 35 | 0 | 35 | 1 |
| Sri Lanka | 0 | 200 | 200 | 1 |
| Indonesia | 321 | 137 | 458 | 60 |
| Vietnam | 70 | 1,074 | 1,144 | 8 |
| India | 14,821 | 950 | 15,771 | 11 |
| Malaysia | 4387 | 72 | 4459 | 25 |
| Thailand | 6105 | 0 | 6105 | 6 |
| Korea | 16,387 | 9,217 | 25,604 | 21 |
| Singapore | 4,000 | 40,000 | 44,000 | 20 |
| Taiwan | 14,000 | 36,000 | 50,000 | 20 |
| Hong Kong | 11,000 | 34,000 | 45,000 | 13 |
| Japan | 55,000 | 2,277 | 57,277 | 5 |
| Australia | 54,319 | 11.00 | 54,330 | 6 |
| China | 472,682 | 1,04,203 | 576,885 | 2,000 |
| Asia Pacific Total | 653,171.28 | 228,140.72 | 881,312.00 | 2,199 |